
&
&
~~~~~~~~~~#########~~~~~~~~~~
Posted by:
Greg Lance – Watkins
Greg_L-W
eMail:
Greg_L-W@BTconnect.com
The BLOG:
https://InfoWebSiteUK.wordpress.com
The Main Web Site:
www.InfoWebSite.UK
~~~~~~~~~~#########~~~~~~~~~~
.
Hi,
.
It has been hotter, fires have burnt larger areas
The word unprecedented is applied to almost every bad thing that happens at the moment, as though particular events could not have been predicted, and have never happened before at such a scale or intensity. This is creating so much anxiety, because it follows logically that we are living in uncertain time: that there really is a climate emergency.
The historical evidence, however, indicates fires have burnt very large areas before, and it has been hotter.
Some of the catastrophe has been compounded by our refusal to prepare appropriately, as is the case with the current bushfire emergency here in Australia. Expert Dr Christine Finlay explains the importance of properly managing the ever increasing fire loads in an article in today’s The Australian. While there is an increase in the area of national park with Eucalyptus forests, there has been a reduction in the area of hazard reduction burning.
The situation is perhaps also made worse by fiddling with the historical temperature record. This will affect the capacity of those modelling bushfire behaviour to obtain an accurate forecast.
We have had an horrific start to the bushfire season, and much is being said about the more than 17 lives lost already, and that smoke has blown as far as New Zealand. Unprecedented, has been the claim. But just 10 years ago, on 9 February 2009, 173 lives were lost in the Black Saturday inferno. On 13th January 1939 (Black Friday), 2 million hectares burnt with ash reportedly falling on New Zealand. That was probably the worst bushfire catastrophe in Australia’s modern recorded history in terms of area burnt and it was 80 years ago: January 13, 1939.
According to the Report of the Royal Commission that followed, it was avoidable.
In terms of total area burnt: figures of over 5 million hectares are often quoted for 1851. The areas now burnt in New South Wales and Victoria are approaching this.
Last summer, and this summer, has been hot in Australia. But the summer of 1938-1939 was probably hotter. In rural Victoria, the summer of 1938-1939 was on average at least two degrees hotter than anything measured with equivalent equipment since, as shown in Figure 1.
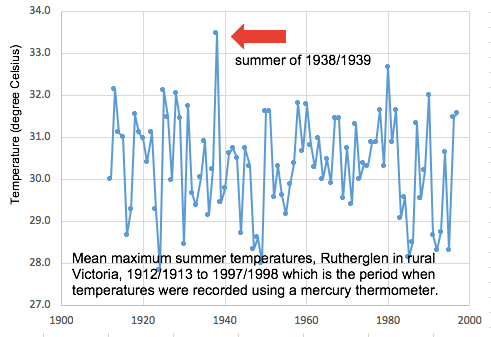
The summer of 1938-1939 was probably the hottest ever in recorded history for the states of New South Wales and Victoria. It is difficult to know for sure because the Bureau has since changed how temperatures are measured at many locations and has not provided any indication of how current electronic probes are recording relative to the earlier mercury thermometers.
Further, since 2011, the Bureau is not averaging measurements from these probes so the hottest recorded daily temperature is now a one-second spot reading from an electronic devise with a sheath of unknown thickness. In the United States similar equipment is used and the readings are averaged over five (5) minutes and then the measurement recorded.
The year before last, I worked with the Indonesian Bureau of Meteorology (BMKG), and understood their difficulty of getting a temperature equivalence between mercury thermometers and readings from electronic probes at their thousands of weather stations. The Indonesian Bureau has a policy of keeping both recording devices in the same shelter, and taking measurements from both. They take this issue very seriously, and acknowledge the problem.
The Australian Bureau of Meteorology has a policy of a three year period of overlap, yet the metadata shows that for its supposedly highest quality recording stations (for example Rutherglen), the mercury thermometer is removed the very same day an electronic probe is installed. This is a total contravention of the Bureau’s own policy, and nothing is being done about it.
I explained much of this to Australia’s Chief Scientist in a letter some years ago — neither he, nor the Bureau, deny that our current method of recording temperatures here in Australia is not covered by any international ISO standard. It is very different from methods currently employed in the United States and also Indonesia, and as recommended by the World Meteorological Organisation.
Then there is the issue of the remodelling of temperatures, I explained how this affects trends at Rutherglen in a blog post early last year.
The remodelling, that has the technical term of homogenisation, is a two-step process. With respect to the temperature maxima at Rutherglen, the Bureau identified a ‘statistically significant discontinuity’ in 1938–1939. Values were then changed.
It is somewhat peculiar that the Bureau did not recognise, in its process of remodelling the historical data for Rutherglen, that the summer of 1938-1939 was exceptionally hot because of drought, compounded by bushfires. Rather David Jones and Blair Trewin at the Bureau used the exceptional hot January of 1939 as an excuse for remodelling the historical temperature record at Rutherglen, with the changed values subsequently incorporated into international data sets.
These made-up values are then promoted by the United Nations’ International Panel on Climate Change (IPCC). This propaganda is then tweeted by Hollywood superstars like Bette Midler to The Australian Prime Minister.
After a recent Sky News Television interview that I did with Chris Smith several people have contacted me about the hottest day ever recorded in Australia. They have suggested it is 16th January 1889 being 53.1 degrees Celsius at Cloncurry in Queensland. A problem with this claim is that the temperature was not measured from within a Stevenson screen, though it was a recording at an official station. A Stevenson screen (to shelterer the mercury thermometer) was not installed by Queensland meteorologist Clement Ragge at Cloncurry until the next month, until February 1889.
The hottest temperature ever recorded in Australia using standard equipment (a mercury thermometer in a Stevenson screen) at an official recording station is 51.7 degrees Celsius (125 degrees Fahrenheit) at the Bourke Post Office on January 3, 1909.
We are all entitled to our own opinion, not our own facts.
*****
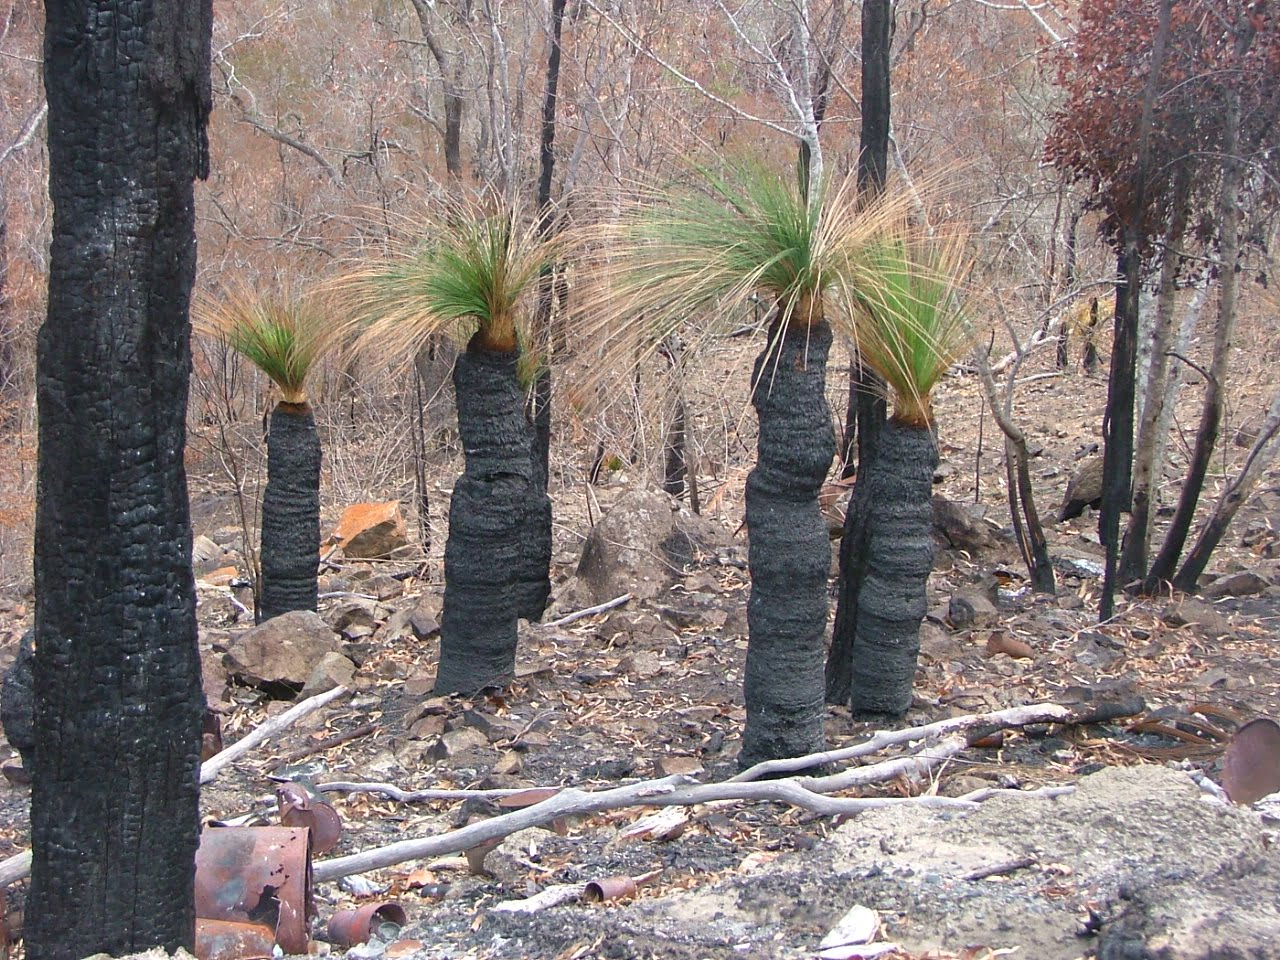
The picture featured at the very top of this post is of grass trees at Scott River, Western Australia, taken in January 2007, following a “mild, patchy burn” by David Ward.
David has contributed several articles on bushfire management to this blog, you can find some of the links here:
http://jennifermarohasy.com/2009/04/the-mathematics-of-connectivity-and-bushfire/
.
To View the Original Article CLICK HERE
About Me

Some of the comments generated with many useful links:
says
Trackbacks
-
[…] reposted from Jennifer Marohasy’s weblog […]
-
[…] Miscellaneous Matters: Tomorrow’s Gods: What is the future of religion? The Religion of Climatism Australia: It has been hotter, fires have burnt larger areas Archive: Green ideology, not climate change, makes bushfires worse Alex Epstein video: The most […]
-
[…] It has been hotter, fires have burnt larger areas […]
-
-
[…] Miscellaneous Matters: Tomorrow’s Gods: What is the future of religion? The Religion of Climatism Australia: It has been hotter, fires have burnt larger areas Archive: Green ideology, not climate change, makes bushfires worse Alex Epstein video: The most […]
-
[…] READ MORE AT JENNIFER MAROHASY […]
-
[…] This article originally appeared at the author’s website. […]
-
[…] -Hitametin eldri. Allnokkrir hafa komið að máli við mig og talið að hæsti hiti sem mælst hefur í Ástarlíu sé 53,1 sem mældist þann 16. janúar, 1889 í Cloncurry, Queensland. Vandinn er að mælingin var ekki gerð í Stevensonkassa (staðlað mælahús) jafnvel þó mælingin hafi verið gerð á opinberum mælistað. Hæsti hiti sem mælst hefur í Ástarlíu, með stöðluðum kvikasilfurmæliaðferðum á opinberum mælistað, er 51,7°C við Bourke Post Office 3. janáura 1909“ -. Jennifer Marohasy […]
-
[…] Deport, which argues not solely that Australia’s present wildfires and excessive temperatures are not unprecedented, however that environmental activists are to blame for standing in the way in which of managing the […]
Regards,
Greg_L-W.
tel: 44 (0)1594 – 528 337
Calls from ‘Number Withheld’ phones Are Blocked
All unanswered messages are recorded.
Leave your name & a UK land line number & I will return your call.
‘e’Mail Address: Greg_L-W@BTconnect.com
&
TWITTER: @Greg_LW
&
&
Please Be Sure To
. .
.
Re-TWEET my Twitterings
https://twitter.com/Greg_LW
My MainWebSite & Blogs
eMail:
Greg_L-W@BTconnect.com
The BLOG:
https://InfoWebSiteUK.wordpress.com
The Main Web Site:
www.InfoWebSite.UK
~~~~~~~~~~#########~~~~~~~~~~

Jenny
Thanks for your continuing work on this issue. You write “We are all entitled to our own opinions. But not to our own facts”.
But our publicly funded Bureau of Misinformation ( BOM ) is continually generating it’s own fake ‘facts’ !
And I assume you have kept track on Ken Stewart’s work examining all the BOM’s 720 weather stations to see if they are compliant with the BOM’s own siting guidelines. Ken discovered that over 300 are NOT.
https://kenskingdom.wordpress.com/
January 4, 2020 at 2:16 pm
Misfeasance, and malfeasance come to mind, particularly as the emergency response teams need accurate data to plan their responses. Paraphrasing (with good license) that well worn phrase coined by someone leading the country, “where the bloody hell [is the responsible minister]” in getting the BoM to correct their stupid actions in what is plainly a falsification of public data?
January 4, 2020 at 5:15 pm
Mind boggling how big power bases have grown on misinformation. Even more mind boggling is that as the truth struggles its way to the surface, no one with the authority to do so steps in to stop the rorts.
January 4, 2020 at 7:13 pm
I’ve been reading your articles and watching your youtube lectures for some years. I met Dick Lindzen in Boston recently for some sane discussion, which is difficult to find in Australia on this topic. Thank you for this explanation about the history of our terrible fires.
Yours,
David Lubowski
Conjoint Professor in Surgery, University of New South Wales
January 5, 2020 at 7:38 am
Australia’s Bureau of Meteorology’s national temperature series = not fit for purpose.
Australia’s Bureau of Meteorology = in breach of its own standards, and of international standards, and not subject to external review.
Australia’ Morrison government = doesnt care.
January 5, 2020 at 10:29 am
Outstanding work, as usual, Jennifer.
Here in NZ there has been skull-duggery too. Public comments are always being made by NIWA (our equivalent to the CSIRO) about the “hottest since NIWA’s records began”. Yet NIWA was only formed in 1992. Their records then, are less than 30 years old, the amount required to construct a national average. Presumably then, NIWA’s records began in 1992, are not verifiable and therefore worthless.
Before 1992, measurement of temperatures was done by the metservice division of the DSIR (Department of Scientific and Industrial Research, which was dissolved in 1992), and the isobaric mapping was done by the Lands and Survey Department for the Geography department of the University of Auckland.
Public records, which had been paid for by the taxpayer, were all handed over to NIWA which now had shareholders and had to show a profit. After NIWA had formed, a set of temperature figures for one town would cost me about $300, and for three towns worth I was paying S1000. Public pressure eventually made them free, but only available by subscription to a third organisation, called Cliflo.
It was because no one agency spoke with one official voice, that NIWA was formed. There was, at the time, conflict between the NZ Metservice which had grown to be an independent body and NIWA. The newcomer was seen as an unnecessary duplication of services and waste of public funds. Moreover, there was a political motive, and NIWA’s mission statement was that its function was to reflect government policy about the environment, whatever that government policy was. That is still the case today, and NIWA’s main reason for existence still seems to be to spread propaganda for global warming. They are not above making up reasons for scary statistics that have no basis in truth.
January 5, 2020 at 11:50 am
I posted at WUWT because of the photo by David Ward, of grass trees at Scott River.
I’ll re-post here:
The photo at the top is a reminder:
While fires are burning it is hard to know what is going on. So we see maps with big splotches of red.
But not everything within those red areas burn.
Send in a team and determine how much and how seriously the terrain is damaged.
After fire-audits are often done.
The U.S. Forest Service does this on a regular basis. The results come a year after the fire so the MSM don’t notice. Those that look at these audits are surprised at how much is not burned and how quickly much of the rest regrows.
[We live east of the Cascade Mountains in Washington State. Fire is natural on the east slopes, and the shrub/steppe.]
January 5, 2020 at 12:02 pm
Maybe worth a look at http://www.waclimate.net/very-hot-days-eastern-australia.html, an analysis of the frequency correlation between rainfall, very hot days (40C+) and average maxima in eastern Australia – including a spotlight on the 20 ACORN stations (with a start year of 1910) in the drought/bushfire zone of southern Queensland and all of NSW.
ACORN 1, ACORN 2 and RAW historic temperatures are compared, suggesting that ACORN algorithms don’t care how many clouds (rainfall is a proxy) were influencing temperatures in the early 1900s.
In the long term across eastern Australia, rainfall is up (mostly Queensland) and very hot days are down. However, at the 20 ACORN stations in the central eastern states (i.e. bushfire zone) rainfall has been in decline for about 30 years (following increased rainfall from 1950 to 1990).
In the short term, very low rainfall in the drought zone since 2015 is the primary spark for the current bushfire crisis (coupled with reduced firebreaks and increased human population/cause of fire).
Smaller screen AWS readings are likely to be contributing to perceived warming, but rainfall (aka cloud) correlations are worth considering as a more likely contributor than CO2 to both broader climate “change” and the current drought/bushfire issue in Australia.
January 5, 2020 at 12:15 pm
Please explain this “ Last summer, and this summer, has been hot in Australia. But the summer of 1938-1939 was probably hotter. In rural Victoria, the summer of 1938-1939 was on average at least two degrees hotter than anything measured with equivalent equipment since, as shown in Figure 1.“ my understanding of your article in the spectator implied, if not directly stated, that there was no equivalent equipment after the change to electronic probe – if so the quoted passage does not make sense.
Secondly, my impression is that the averaging issue reflects the instantaneous accuracy of the electronic measuring as opposed to the inherent lag in mercury/ETOH equipment and so is not sinister in itself. Correct?
January 5, 2020 at 2:15 pm
Jennifer (FYI)
New Aust and World record.
Cabramurra (Snowy Mts) temp data on 4th Dec, 2020.
04/04:29pm 50.1 32.4 0.2 5 28.4 W 83 128 45 69 – – 0.0
04/04:27pm 57.0 39.7 1.7 4 33.0 W 82 128 44 69 – – 0.0
04/04:25pm 50.9 36.7 10.7 10 26.2 W 76 128 41 69 – – 0.0
Still available here.
http://www.bom.gov.au/products/IDN60801/IDN60801.95916.shtml
Supposedly hit 69.8C around 4:30pm.
Cabramurra 04/09:20pm 28.8 23.8 -1.3 14 15.0 WNW 15 19 8 10 – 0.0 28.8 09:20pm
69.8 04:26pm W
Obviously a problem with the ethermometer or a built in bias that went horribly wrong.
OTOH, maybe a nearby fire?
No temp for that day on DWO yet.
http://www.bom.gov.au/climate/dwo/IDCJDW2023.latest.shtml
January 5, 2020 at 3:31 pm
Thank you for this interesting article and summary of relevant facts. Someone above from the US mentioned the measurement of areas burnt by fire. I have wondered this myself. The RFS shows greyed out terrain behind a firefront as completely burnt. However, when I visited Bilpin NSW last week after a major fire tore through there….there was surprisingly great amounts of vegetation untouched. Certainly the Gospers fire was severe; especially so at Bell and Mt Wilson – but it does lead one to seriously wonder HOW the “area burnt” is calculated. Can you enlighten us?
January 5, 2020 at 3:41 pm
I found this article really interesting. I note that an estimated 5 million hectares burnt in 1853, but perhaps this isn’t comparable to modern times given we now have aerial firebombers and fire trucks fighting the fires. Certainly in my region, fires burn significantly less due to the efforts of firefighters. Also, the size of national parks may have increased but the area of actual, physical bush certainly hasn’t. I wonder how this fits in?
January 5, 2020 at 4:40 pm
With regard to the electronic temperature measuring equipment, what is the timeframefor the maintenance and calibration cycle and where are the records of those checks kept .
January 5, 2020 at 5:36 pm
Hi Jennifer,
I truly believe that the current bush fire disaster is unprecedented and that your comparison with the 1851, 1939 and 2009 fires is misleading.
You brought up the size of the 1851 and 1939 fires to try and down-play what we are currently going though, but you should realise these blazes were largely left to burn themselves out. The firefighters simply didn’t have tools to effectively fight the blaze. They burned and burned until they were naturally extinguished either by running out of fuel of changes in weather. Today we have so many more men on the ground, trucks, helicopters dumping water, planes dumping suppressant, and such a better understanding of weather conditions and the movement of fires. Yet the fire has still been burning for months.
The 2009 fires were a disaster and had a massive death toll – but the situation today is very different. Evacuations are handed much better and information travels more quickly and has further reach with new technology. There are also new policies in place as to when an evacuation is required. Just because the 2009 fires had a higher death toll doesn’t change the fact that these fires are far worse. This is beyond just a natural disaster.
January 5, 2020 at 7:56 pm
Trend data is different to individual dates.
Would you mind disclosing the major funding contributors of think tanks you have been involved with?
****
Kerri Fuller,
I would be interested to see the trend data, surely some is held by the CSIRO?
My work is funded by the B.Macfie Family Foundation and has been for some time.
My history of employment/funding was detailed in a letter to Media Watch, here https://www.abc.net.au/mediawatch/transcripts/1207_marohasy.pdf
I also blogged about these types of questions not so long ago, here: https://jennifermarohasy.com/2019/09/how-to-evaluate-the-evidence-of-contrarians-scientifically/
January 5, 2020 at 8:02 pm
David Lubowski
If you have the time, could you provide a short summary of Richard Lindzen’s comments to you, please ? I regard Richard as providing probably the most lucid, literate, pin-point analyses of the situation that I have ever accessed. He combines that with encyclopaedic knowledge. In short, I have great respect for his scientific competence and honesty.
Jennifer
Thank you for continuing to supply hard information and incisive articles. The traffic here has become invigorating.
As far as the BoM’s reputation is concerned, most of us are aware that Greg Hunt protected it in the Abbott Cabinet from independent inquiry on the basis that such an inquiry if made public was very likely to damage the BoM’s repuation and that of the Fed Govt by association. In short, political ego above honesty.
January 6, 2020 at 2:19 am
Jon D says January 5, 2020 at 5:36 pm
Did they have 200+ arsonists running around setting fires in those days?
Do you disagree with prescribed burning?
January 6, 2020 at 5:09 am
Jon
Many fires in the NP have been left to burn because fire fighters will not go into them due to the lack of fire trails and poor road maintenance. Thus the fires will grow in intensity and begin to crown. Quite often the fire will join with another causing an even greater firestorm.
Containment lines are set up outside the parks but by then the fires, coupled with high winds, will jump these lines.
It’s true that aircraft can now be used but when the smoke is too thick they are grounded.
So it is true that we now have more resources but much of the area burnt has been in NP and has been allowed to burn because it’s unsafe to go into them.
These fires are bad but not unprecedented. 1951-52 were similar to these fires as they burnt in similar areas. 1974-1975 fires in NSW burnt out 4.5 million hectares in the far west.
Downplaying previous horrific fires dismisses the bravery of those that fought them and died in them. I’m sure that those who have suffered in these fires would not like to be summarily dismissed by another catastrophic fire in the future.
January 6, 2020 at 8:52 am
A C Osborn,
Sure – a lot of fires are lit either intentionally or unintentionally by man. That happened in the past is will continue to happen in the future. The differences now are the fuel and conditions. I fully support hazard reduction burns. As do the Greens despite having the finger pointed at them by the politicians.
Ian George,
Of course the fire is unpredictable and we can’t always win. Fireies are still doing a lot to contain it and it makes a difference. I’m sure the thousands that have lost homes to these fires would not like their loss to be downplayed by an article that states ‘well technically there were larger fires in 1851’.
January 6, 2020 at 10:30 am
Sorry Jon but your statement set the tone.
‘Just because the 2009 fires had a higher death toll doesn’t change the fact that these fires are far worse. This is beyond just a natural disaster.’
And 1851, 1939, 1951/2 1967, 1974/5 and 2009 weren’t ‘beyond just a natural disaster’.
You miss the important point. Because the NPs are locked up and not properly maintained, the area burnt is greater, and the fire more intense, as noone will fight them at source – and this has partly led to this catastrophe.
January 6, 2020 at 10:40 am
Is this the same Jennifer Marohasy affiliated with the IPA, which probably wouldn’t exist without the funding of mining magnates like Gina Rinehart?
Anyway, you to foil hats can keep your theories to yourselves. The Earth is warming. https://www.washingtonpost.com/graphics/2019/national/climate-environment/thermometers-climate-change/
That’s the reason we can’t do proper fuel reduction. There’s less suitable days for it with the increased heat.
https://www.abc.net.au/news/2018-09-13/is-the-prescribed-burn-window-closing-in-australia/10236048
****
Luke,
There is no political will, and insufficient resourcing, that is the only reason that there has been such woefully inadequate hazard reduction burning this last year.
It’s not particularly hot, and the drought is not exceptional.
Also, I’m funded by the B. Macfie Family Foundation, and Gina Rinehart is a national treasure.
Cheers, Jennifer Marohasy
January 6, 2020 at 1:47 pm
Extracts re 13 Jan 1939 from A Study of Meteorological Conditions Associated with Bush and Grass Fires and Fire Protection Strategy in Australia,, published by the BoM in 1947 (http://www.waclimate.net/bushfire-history-australia.pdf) :
“Most disastrous bush fires ever experienced in Victoria swept over three-quarters of the State. Death roll 71. Hundreds of homes, many towns, thousands of acres of forest, timber mills, and famous tourist resorts devastated.”
…
“Seventy-one lives were lost. Sixty-nine mills were burned. Millions of acres of fine forest, of almost incalculable value, were destroyed or badly damaged. Townships were obliterated in a few minutes. Mills, houses, bridges, tramways, machinery were burned to the ground; men, cattle, horses, sheep were devoured by the fires or asphyxiated by the scorching debilitating air.”
…
“On that day it appear that the whole State was alight. At midday, in many places, it was dark as night. Men carrying hurricane lamps worked to make safe their families and belongings. Travellers on the highways were trapped by fires or blazing fallen trees, and perished. Throughout the land there was daytime darkness.”
…
“The speed of the fires was appalling. They leaped from mountain peak to mountain peak, or far out into the lower country, lighting the forest 6 or 7 miles in advance of the main fires. Blown by a wind of great force, they roared as they travelled. Balls of crackling fire sped at a great pace in advance of the fires, consuming with a roaring, explosive noise all that they touched. Houses of brick were seen and heard to leap into a roar of flame before the fire had reached them.”
__
Victoria’s population in 1939 was 1,870,661 and is currently about 6,600,000. I accept that “three-quarters of the State” is probably an exaggeration (albeit a BoM academic bulletin and not the media), but that equates to 17,058,300 hectares.
Even with ACORN 2 cooling, Victoria’s January 1939 average maximum had an anomaly of +2.89C. There’s a fair chance the cause was rainfall across Victoria being just 425.49mm in 1938, the fifth lowest from 1900 to 2019 (2019 was 473.07mm).
January 6, 2020 at 4:51 pm
Jon D says
January 5, 2020 at 5:36 pm
(in up-playing the current fires) “Yet the fire has still been burning for months.”
You seem to think that modern resources can have a serious effect on limiting the size of bushfires which makes these ones much more “mine is bigger than yours” compared to 1851 and 1939. If that was so, how come these are so out of control?
It doesn’t how many fire twucks you have wunning awound or pwanes waterbombing – all they can do is protect some assets and hopefully save some lives. The main bushfire continues on regardless. They’re much bigger than us, no matter what technology we throw at them. Ultimately they are natural disasters beyond our control.
No matter how stupendous may be the hubris of humans thinking they can control the weather, it still doesn’t match the gullibility of believing more or less whatever climate propaganda is thrust upon them.
Oh and by the way, these fires will not be extinguished by firefighters. They will eventually burn themselves out. Just like in 1851 and 1939.
January 6, 2020 at 5:28 pm
I would have thought the issue that should be discussed is water or the lack there of rather than how we measure temperatures and other questionable technical practices.
When the first fleet arrived in 1788 it’s estimated that there were somewhere between 750,000 and 1.3 million Aboriginal inhabitants in Australia.
Since then the population has grown to around 25 million so it goes without saying our demand on the rainfall and aquifers of this country have experienced a serious increase in demand. Up until white settlement the Aboriginals took no water out of the landscape, whatever fell on the land followed natural processes in it’s travels to the ocean and so was available to all the flora and fauna of this continent during that journey.
The white population on the other hand flush our toilets with potable water, fill our swimming pools, wash our cars, have showers, have air-conditioned buildings using water in the heat exchangers, grow things here and ship them off overseas with most of the moisture and nutrients going with them, food from the country is consumed in the cities and the waste either sent to landfill or flushed out to sea rather than recycled to the country, and use potable water in many of our industrial processes all on the driest inhabited continent in the world.
These behaviours leave little water for the landscape which has slowly become drier and drier until we find ourselves in the current situation. Australia isn’t the only place this is happening just the most severely effected. If people think water for the environment is wasted water, wait and see what happens to our economy and lifestyle now we’ve trashed that environment.
Fighting fires does not make it rain and seems like a band-aid rather than a solution.
I’ll leave all the knowledgeable people here to pick this post to pieces. Enjoy yourselves.
January 6, 2020 at 6:35 pm
Study released 2013 (Giglio et al) provides intresting additional data into this discussion. Study creates a global burned area dataset for years 1996-2011. It also provides the total area burned for each individual year per continent.
For Australia it provides combined area burned for Australia and New Zealand.
According to the study the total area burned between 1996-2011 in Australia and New Zealand combined was between 16.3 Mha (2010) and 83.2 Mha (2011).
Thus, the total area quoted in the press for this season (ca 6 Mha) seems smallish in conparision.
https://agupubs.onlinelibrary.wiley.com/doi/full/10.1002/jgrg.20042
January 7, 2020 at 4:08 am
Just found this (thanks to an ex-colleague who is in South Africa). I think David Packham is an expert in the field, am I right?
https://www.2gb.com/podcast/scientist-david-packham-on-whats-really-causing-the-bushfires/?fbclid=IwAR3-DSpK0E69TdJEIgQRKFQ3iunEZdham-2GVZNIam5aw3bzONfWRgAlq8Q
January 7, 2020 at 8:56 am
The civil servants masquerading as scientists at the BOM are complicit in providing false and misleading temperature data in order to promote a political climate message. The current Australian government must dismiss all of the BOM staff who continue this climate fraud.
January 7, 2020 at 2:03 pm
Totally agree, Richard. It’s not just about ACORN , that’s bad enough.
I just noticed today that Casino had 32.9C at 1:50pm. Yet the high temp was 33.9C – also at 1:50pm. That’s a 1.0C change in the same minute.
BoM have to compare LITs with ethermometers to see the difference – they did with the Glaisher and the SS (and then dismissed all the temp readings before 1910 on the basis of that comparison).
January 7, 2020 at 3:38 pm
Jennifer.
I live in the small country town of Young in the south west of NSW. From BOM records it appears our hottest January day occurred on 18 January 2013 and was 42.6c. I followed our local weather last Saturday 4th January on the BOM 10min update of temperatures etc. The BOM had predicted 44.0c for that day. The maximum temperature recorded that day by BOM, and listed on their 10min update, was 42.7c at 3.48pm and 4pm. Other temperatures listed by BOM around that time were… 3pm 41.5…4.25pm 40.3c. So one could assume that the maximum temperature for the day was 42.7c.
But NO it wasn’t apparently……BOM has recorded the maximum temperature for Young on its monthly update page as….wait for it… 44.9c measured at 3.27pm.
My own recordings of temperatures on that day were 3pm 41.8c , 4pm 42.4c.
BOM did not put it up on the 10min update page that at 3.27pm the temperature reached 44.9c. Yet somehow the maximum temperature was listed sometime later, Sunday, as 44.9c.
The maximum temperature was still listed some two days later on the 10min update sheet as 42.7c.
Its not the first time I have come across an over exaggeration of summer temperatures by BOM.
January 7, 2020 at 7:09 pm
It’s about management of the land-
“After World War II, missions towns and cattle stations lured Aboriginal people away from their homelands with promises of work and education. [2] Fire management stopped with severe consequences for the land”
Source: Cool burns: Key to Aboriginal fire management – Creative Spirits, retrieved from https://www.creativespirits.info/aboriginalculture/land/aboriginal-fire-management
https://www.dpaw.wa.gov.au/management/fire/fire-and-the-environment/41-traditional-aboriginal-burning
January 7, 2020 at 7:20 pm
Refer to:
https://saltbushclub.com/2020/01/06/bushfires-are-nothing-new/
which quotes an “excerpt from Jennifer Marohasy’s blog”
and the comments under that Saltbush article – which in turn link to Jennifer Marohasy on Wikipedia
January 7, 2020 at 9:42 pm
In an opinion piece in The Sydney Morning Herald (Nov 3, 2019) ecological criminologist Paul Read presented convincing evidence that every year, almost 9 of 10 bushfires are intentionally and unintentionally lit by individuals.
It now seems this bushfire season is also mostly human caused.
January 8, 2020 at 7:14 am
Lets put these fires into perspective.
As at 04/01/20, 6.3 million hectares had been burnt. The 1974/75 bushfires burnt 103 million hectares.
Also, lets look at hazard reduction. In 2019, in NSW, there was 960000 hectares burnt through hazard reduction, yet the next highest year for hazard reduction burns was 20 years ago in the year 2000 when just 260000 hectares were burnt. So for 20 years, we did almost 75% less hazard reduction annually, and now we are surprised at the extent of the fires?
January 8, 2020 at 2:51 pm
Jennifer,
Excellent work. When the trolls have to impugn your work because of their false insinuations about your funding you can be confident you are on to something correct.
Australia, like California, has enviro policy dominated by anti-science special interests who believe apocalyptic claptrap and set policy accordingly. Perhaps these arsonist caused fires in bush country made vulnerable by green policies will wake enough people up to force through rational enviro policies.
But then I’m an optimist.
January 9, 2020 at 7:39 am
Wikipedia has deleted their list of, ‘Scientists arguing that global warming is primarily caused by natural processes’.
The Australian grouping includes Jennifer Marohasy.
The list has been archived by the WayBackMachine – Internet Archive. It is available at:
https://web.archive.org/web/20191115154603/https://en.wikipedia.org/wiki/List_of_scientists_who_disagree_with_the_scientific_consensus_on_global_warming
January 9, 2020 at 8:21 am
Greens website, 14 December 2019: (via Wayback Machine)
“let us kill off the furphy of clearing trees to protect homes. Trees around your home make very little difference to fire risk . . . ” https://web.archive.org/web/20170716013738/https://greens.org.au/bushfires
Greens website, 6 January 2020:
“The Australian Greens support hazard reduction burns and backburning . . . ” https://greens.org.au/bushfires
January 9, 2020 at 2:36 pm
Hunter is quite right. The trolls will seek to impugn your integrity because they have no other weapon to use against you. Keep it up! I can figure out whether I’m being deceived or not – something that the likes of Luke will always have difficulty accepting.
January 9, 2020 at 9:53 pm
Proof that fuel reduction burns works – side by side evidence from the Gippsland fires
https://www.facebook.com/100002016588058/posts/2634590983284762/
Posted the same in WUWT under “Reckless and Selfish”: Aussie Politicians Urge Climate Activists to Cancel Protest
January 9, 2020 at 10:29 pm
Luke
You ask about JM’s funding. I always find this line interesting: the funding of the climate alarmists and the IPCC is from federal governments, all of which demand the alarmist line. Try get funding for a study that shows otherwise. Try work in a University and do serious unbiased climate work that doesn’t push the alarmist line- ask young scientists or post-docs and you will be surprised. The alarmist funding conflict is widespread and endemic.
January 10, 2020 at 5:19 am
Could we get an update on human caused or arson caused fires in the last few months?
It seems the “Guardian” is suggesting that most of the arson or arson arrests were earlier in the year 2019.
January 12, 2020 at 6:04 pm
Luke,
I wonder how much warmer your alpine station was when Hannibal crossed the alps with all those elephants during the Roman Warm Period?
Many, possibly all, of our previous bad fires were the result of positive IODs yet somehow, with this happening during another positive IOD, this one is somehow the result of our CO2 emissions.
Even when it is commonly recognised by all those closely involved, that authorities have been increasingly slack in carrying out fuel reduction burns for the last couple of decades.
And there have been no shortage of opportunities to burn, just a shortage of inclination and desire.
January 13, 2020 at 4:30 pm
Australia’s bush fire’s have nothing to do with climate change and everything to do with mismanagement. We have removed high country grazing reduced controlled burning, don’t allow us firefighters to back burn, Restrict private landholders rights to put in fire breaks, and allow more and more people to live in these area’s.
I have been fighting these fires for months the whole narrative has been hijacked by this climate change crap which has NOTHING to do with these fire’s and everything to do with land mismanagement.